
The latest version of HornetQ as part of JBoss EAP 5.1.2 has once again been
benchmarked against SPECjms2007 (c).
HornetQ is also included on JBoss AS7, which contains the same improvements we have made to achieve this performance. You will also be able to get the same performance figures with JBoss AS7.
This latest benchmark has outperformed HornetQ's latest publication by a good margin
already.
With this latest result HornetQ sustained a load of about 8 million messages per
second.
SpecJMS is a peer reviewed benchmark and is the first industry standard and has strict
rules as to how each messaging system is configured. This is to make sure that vendors
don't cheat when it comes to persistence and transactional requirements etc. SPEC is an independent corporation comprised of
representatives from commercial and academic organisations. The corporation creates many
industry standard benchmarks for Java amongst others. The
benchmark simulates how a Message System would be used in a real world scenario.
The
software supports three topologies, Horizontal, Vertical and Freeform. Only Horizontal
and Vertical can be used for publishing a result. Freeform can be useful to create a
custom workload to test the Messaging System for a given usecase.
Horizontal Topology is where the benchmark scales the number of Topic Subscriptions
and Queues whereas a Vertical topology has a fixed number of queues but sends varying
volumes of messages depending on the scale.
* The Horizontal results can be found here
* and the Vertical results here.
The scale is configured by setting the BASE configuration property value. At first
glance the results can look quite confusing but here is a breakdown of the
results:
- What this means in terms of actual performance:
HornetQ sustained a load of about 6 million messages on the vertical topology this can
be seen by looking at the following graph
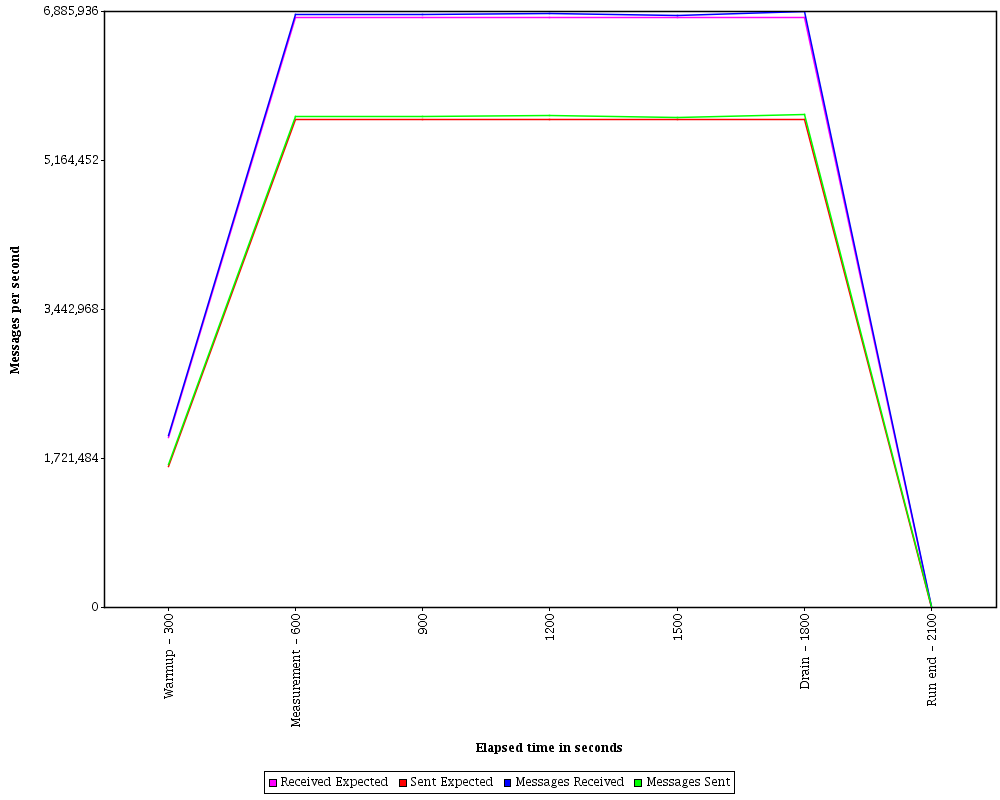
Horizontally HornetQ achieved about 8 million messages per second which is shown on the runtime graph.

The runtime graph is used to show the following:
- The expected versus actual message rates. These provide a quickly check the benchmark driver created enough load for the configured scale.
- The message sent/received spread. You can expect this because topics are used in the benchmark and many clients will receive a single sent message.
- In the Horizontal topology the spread will be greater than Vertical. Horizontal topology by it's nature has a greater distribution of messaging clients.
The system configuration diagram shows the hardware installation used for this result and necessary to
get similar levels of performance.
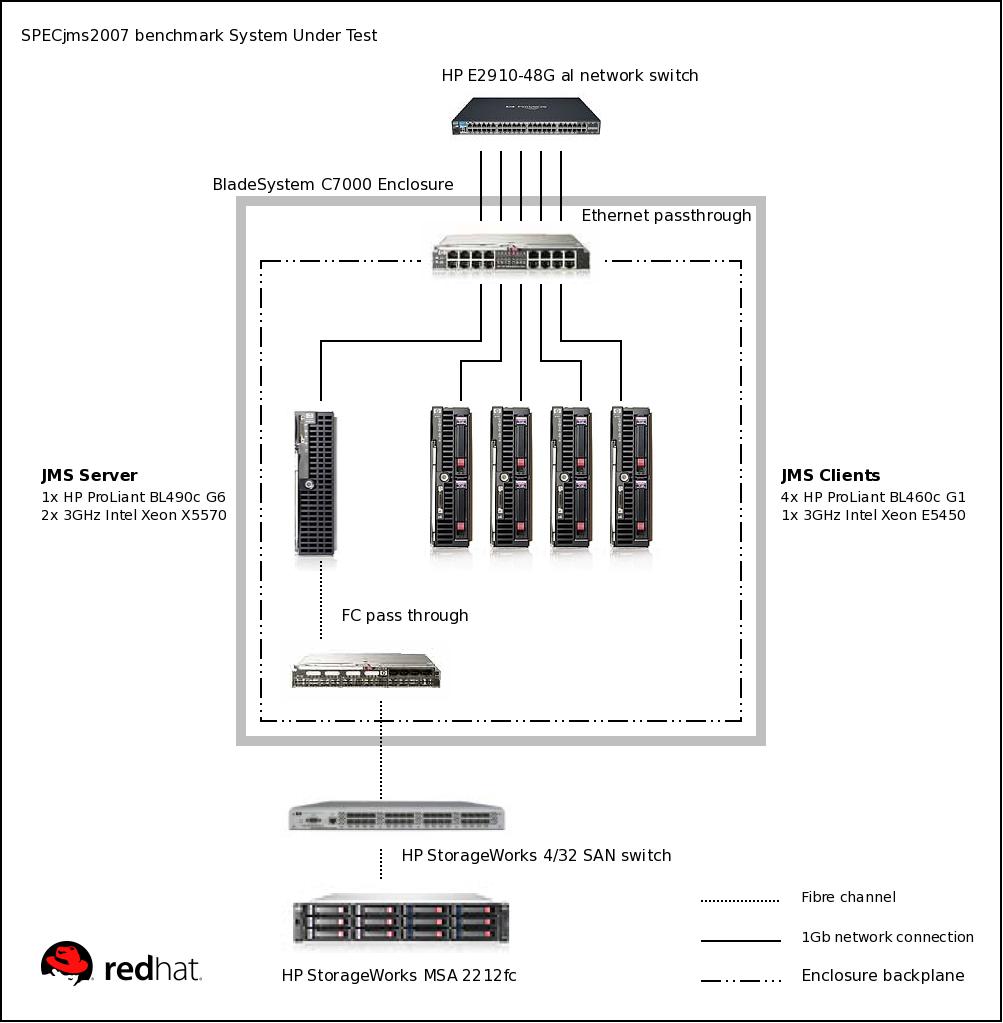
The server was a 2 chip 4 core CPU with 24576 MB of memory and a 1 GbE network
interface. The client's, of which there were 4, were 1 chip 4 core CPU with 22528 MB of
memory and also a 1 GbE network interface. The HornetQ journal is persisted using a
networked mass storage array available to the messaging server.
A few options were set on the JVM which were as follows:
- -XX:+UseLargePages - this enables large pages
- -XX:LargePageSizeInBytes - set the large page size
- -Xms and -Xmx - setting these both to 3800m stops any memory resizing delays
The following changes were made to the HornetQ Server configuration which were as
follows
- configuration.journal-min-files - this was set to a large number of files
- configuration.thread-pool-max-size - increased level of concurrency
For more detailed information about the benchmark see the DesignDocument
provided by SPEC. Additionally there is an academic paper detailing the workload characterization in greater detail.
Congratulations to the teams involved in this effort!
ReplyDeleteJust awesome!
ReplyDelete"With this latest result HornetQ sustained a load of about 8 million messages per second" - are you 100% certain that you are quoting a per second figure there, or is there a chance that you were talking about the total number of messages sent in the context of the test runs? I think the way this is phrased is somewhat confusing.
ReplyDelete@adypiper: No, the statement is correct. This is 8.2 Million messages Per second.
ReplyDeleteThis is the total throughput (messages / second) on the server involving all the queues (topic subscriptions + jms queues).
The graph here is just an img referencing the SpecJMS website directly. And if you look at the graph produced by the SUT, you will see messages per second on the graph:
http://www.spec.org/jms2007/results/res2011q2/jms2007-20110614-00029.png
The information was generated by the SUT which is a spec.org software. It was peer reviewed by the SPEC group and we would already have had lots of complains from the Spec.org if we made a bad mistake like that.
If you look at the publication itself, you will have the entire submission open (that is, anyone can look at it).
This is the total ammount of messages per second handled by the server, including all the queues (topic subscriptions and JMS queues).
(and to clarify my last comment, I was looking at the horizontal results there, totalling the number of messages processed across the interactions)
ReplyDelete@andypiper: I made a mess with publish / unpublish your comment, and I ended up deleting it for a complete accident.
ReplyDeleteYou may repost it if you can...
But as far as I remember you said that you looked at the total sum of messages consumed versus the time and the amount didn't match with the calculations made by spec.
As far as I know the calculations are correct, and you would need to look at the full disclosure. I don't think that information is out there on the HTML.
The calculation was done by the spec.org software.
All the other results are showing equivalent figures. just navigate on the other publications. (the other HornetQ and ActiveMQ publications).
Thanks Clebert. In my previous comment I'd listed a sum of the total messages produced in the test (which was around about 9.5 million I think), divided against the number of seconds used in the test (2000) and that came out as about 47k msg/sec. I wasn't questioning the "spec calculation" as such.
ReplyDeleteEither way, my own understanding of the SPECjms tests is that the important number (because it gives a true side-by-side comparison of messaging platform performance) is the "score" of 491 for horizonal and 1317 for vertical.
Thanks for taking the time to discuss.
47K messages / second that's nothing for HornetQ. (especially on this hardware).
ReplyDeleteI will have someone who knows the benchmark in more detail to provide more background. The run rules will also provide you some information.